Shellcode is one of the major components for the modern malware. It was originally invented to exploit vulnerabilities and run code on the target process. Recently it is used more as a malware component to defeat easy detections and analysis. It is very common to observe multi-stage highly obfuscated shellcodes used in commodity or APT attacks.
Even though there are a lot of good static and dynamic analysis tools and services that be utilized to observe malware behavior, some malware might have some hidden behaviors that only manifest with special conditions. Some malware might check the presense of virtual environment. There are needs for tools to analyze these threats with deeper granularity.
With this article, we want to discuss one of the approaches to analyze shellcode threats using emulation framework.
Approach: Using Memory Artifacts
The approach presented here is using memory artifacts as the basis of shellcode emulation. Shellcode is, by nature, position independent and is neutral to each processes’ specific environment in most cases. Many implementation that emulates shellcode relies on built-in memory structure. But, theoretically all the necessary memory components are readily avaiable with process dump images. The relevent memory structures like TEB/PEB, loaded module image list and even DLL code should reside in the process image.
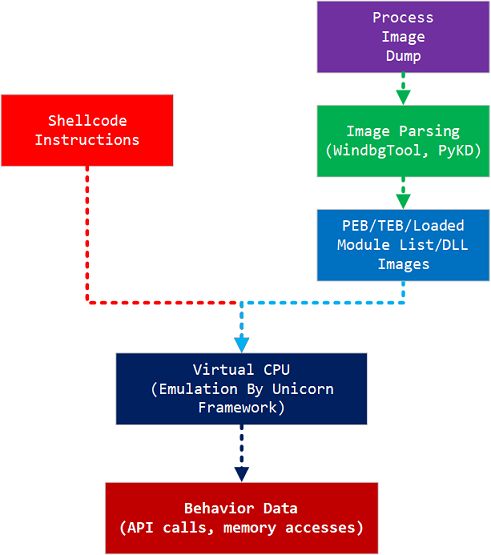
ShellCodeEmulator is the framework that uses Unicorn framework for emulation and uses Windows process dump images as the source of memory artifacts.
Target Shellcode
To demonstrate how this approach works, here is a very simple Windows x64 shellcode sample with SHA1 hash of 33312f916c5904670f6c3b624b43516e87ebb9e3.
PEB Access
The most vital part of shellcode is the one that accesses PEB structure. PEB is a process environment block where process related informations are stored. The PEB is accessed through ‘gs:[rdx]’ memory location. The ‘rdx’ is set to 0x60 and GS:60 is the where PEB pointer is located.
seg000:0000000000000015 65 48 8B 32                                   mov     rsi, gs:[rdx]
seg000:0000000000000019 48 8B 76 18                                   mov     rsi, [rsi+18h]
seg000:000000000000001D 48 8B 76 10                                   mov     rsi, [rsi+10h]
seg000:0000000000000021 48 AD                                         lodsq
seg000:0000000000000023 48 8B 30                                      mov     rsi, [rax]
seg000:0000000000000026 48 8B 7E 30                                   mov     rdi, [rsi+30h]
seg000:000000000000002A 03 57 3C                                      add     edx, [rdi+3Ch]
seg000:000000000000002D 8B 5C 17 28                                   mov     ebx, [rdi+rdx+28h]
seg000:0000000000000031 8B 74 1F 20                                   mov     esi, [rdi+rbx+20h]
seg000:0000000000000035 48 01 FE                                      add     rsi, rdi
seg000:0000000000000038 8B 54 1F 24                                   mov     edx, [rdi+rbx+24h]
The start of PEB structure for x64 platform looks like following. The instruction at offset 0x19 “mov rsi, [rsi+18h]” will retrieve a pointer from “+0x018 Ldr” pointer.
0:000> dt _PEB @$peb
ntdll!_PEB
   +0x000 InheritedAddressSpace : 0 ''
   +0x001 ReadImageFileExecOptions : 0 ''
   +0x002 BeingDebugged    : 0 ''
   +0x003 BitField         : 0x4 ''
   +0x003 ImageUsesLargePages : 0y0
   +0x003 IsProtectedProcess : 0y0
   +0x003 IsImageDynamicallyRelocated : 0y1
   +0x003 SkipPatchingUser32Forwarders : 0y0
   +0x003 IsPackagedProcess : 0y0
   +0x003 IsAppContainer   : 0y0
   +0x003 IsProtectedProcessLight : 0y0
   +0x003 IsLongPathAwareProcess : 0y0
   +0x004 Padding0         : [4]  ""
   +0x008 Mutant           : 0xffffffff`ffffffff Void
   +0x010 ImageBaseAddress : 0x00007ff6`5b530000 Void
   +0x018 Ldr              : 0x00007fff`a2f253c0 _PEB_LDR_DATA
   +0x020 ProcessParameters : 0x00000250`36573480 _RTL_USER_PROCESS_PARAMETERS
   +0x028 SubSystemData    : 0x00007fff`9d6b4440 Void
   +0x030 ProcessHeap      : 0x00000250`36570000 Void
   +0x038 FastPebLock      : 0x00007fff`a2f24fc0 _RTL_CRITICAL_SECTION
   +0x040 AtlThunkSListPtr : (null)
...
The “Ldr” pointer has the following data structure and it contains information about loaded DLL modules. Through this structure, you can access base address of DLLs. “InLoadOrderModuleList” member of this structure has the linked list of loaded modules.
0:000> dt _PEB_LDR_DATA
ntdll!_PEB_LDR_DATA
   +0x000 Length           : Uint4B
   +0x004 Initialized      : UChar
   +0x008 SsHandle         : Ptr64 Void
   +0x010 InLoadOrderModuleList : _LIST_ENTRY
   +0x020 InMemoryOrderModuleList : _LIST_ENTRY
   +0x030 InInitializationOrderModuleList : _LIST_ENTRY
   +0x040 EntryInProgress  : Ptr64 Void
   +0x048 ShutdownInProgress : UChar
   +0x050 ShutdownThreadId : Ptr64 Void
Basically shellcode relies on PEB.ldr structure traversing to locate APIs. In this case it will retrieve the first module’s base (usually kernel32) address and will find the location of WinExec API by comparing API hash value. Eventually the shellcode will run external process (calc.exe) by calling the retrieved API pointer.
GDT (Global Descriptor Table) and Unicorn Framework
The first challenge with providing execution environment for the shellcode is building virtual FS/GS segmentation. On Unicorn framework, you need to build virtual GDT entires. And the selector values for each entries need to be writtent to each segment registers.
The following show the structure of GDT entry. You need to create this entry for each segments with appropriate values.
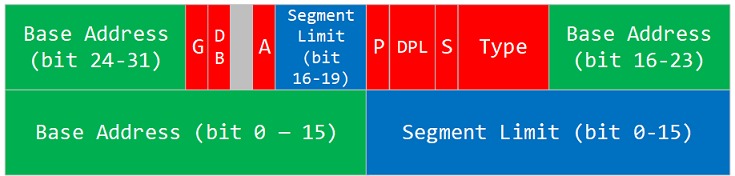
From gdt.py, the GDT entry build code looks like following.
class Layout:

    def create_gdt_entry(self, base, limit, access, flags):
        gdt_entry = limit & 0xffff
        gdt_entry |= (base & 0xffffff) << 16
        gdt_entry |= (access & 0xff) << 40
        gdt_entry |= ((limit >> 16) & 0xf) << 48
        gdt_entry |= (flags & 0xff) << 52
        gdt_entry |= ((base >> 24) & 0xff) << 56
        return struct.pack('<Q',gdt_entry)
The full GDT building code looks like following. Basically, it uses create_gdt_entry to build each GDT entry and assign GDT entry index values to each segments and write the selector value to each segment registers.
    def setup(self, gdt_addr = 0x80043000, gdt_limit = 0x1000, gdt_entry_size = 0x8,
                fs_base = None, fs_limit = None, gs_base = None, gs_limit = None, segment_limit = 0xffffffff):
        gdt_entries = [self.create_gdt_entry(0,0,0,0) for i in range(0x34)]

        if fs_base != None and fs_limit != None:
            gdt_entries[self.fs_index] = self.create_gdt_entry(fs_base, fs_limit , A_PRESENT | A_DATA | A_DATA_WRITABLE | A_PRIV_0 | A_DIR_CON_BIT, F_PROT_32)
        else:
            gdt_entries[self.fs_index] = self.create_gdt_entry(0, segment_limit, A_PRESENT | A_DATA | A_DATA_WRITABLE | A_PRIV_3 | A_DIR_CON_BIT, F_PROT_32)

        if gs_base != None and gs_limit != None:
            gdt_entries[self.gs_index] = self.create_gdt_entry(gs_base, gs_limit, A_PRESENT | A_DATA | A_DATA_WRITABLE | A_PRIV_3 | A_DIR_CON_BIT, F_PROT_32)
        else:
            gdt_entries[self.gs_index] = self.create_gdt_entry(0, segment_limit, A_PRESENT | A_DATA | A_DATA_WRITABLE | A_PRIV_3 | A_DIR_CON_BIT, F_PROT_32)

        gdt_entries[self.ds_index] = self.create_gdt_entry(0, segment_limit, A_PRESENT | A_DATA | A_DATA_WRITABLE | A_PRIV_3 | A_DIR_CON_BIT, F_PROT_32)
        gdt_entries[self.cs_index] = self.create_gdt_entry(0, segment_limit, A_PRESENT | A_CODE | A_CODE_READABLE | A_PRIV_3 | A_EXEC | A_DIR_CON_BIT, F_PROT_32)
        gdt_entries[self.ss_index] = self.create_gdt_entry(0, segment_limit, A_PRESENT | A_DATA | A_DATA_WRITABLE | A_PRIV_0 | A_DIR_CON_BIT, F_PROT_32)

        self.emulator.memory.map(gdt_addr, gdt_limit)
        for idx, value in enumerate(gdt_entries):
            offset = idx * gdt_entry_size
            self.emulator.memory.write_memory(gdt_addr + offset, value)

        self.emulator.register.write_register(UC_X86_REG_GDTR, (0, gdt_addr, len(gdt_entries) * gdt_entry_size-1, 0x0))
        self.emulator.register.write_register(UC_X86_REG_FS, self.create_selector(self.fs_index, S_GDT | S_PRIV_0))
        self.emulator.register.write_register(UC_X86_REG_GS, self.create_selector(self.gs_index, S_GDT | S_PRIV_3))
        self.emulator.register.write_register(UC_X86_REG_DS, self.create_selector(self.ds_index, S_GDT | S_PRIV_3))
        self.emulator.register.write_register(UC_X86_REG_CS, self.create_selector(self.cs_index, S_GDT | S_PRIV_3))
        self.emulator.register.write_register(UC_X86_REG_SS, self.create_selector(self.ss_index, S_GDT | S_PRIV_0))
Process Image
Now the basic requirements for the shellcode emulation is done, next step is providing appropriate memory data from process dump image. Simply you can just take memory dumps from notepad.exe. If the shellcode checks the process name or process environment for specific process, you might want to take dump for those processes. It will provide more specific memory environment for the emulation. Using Process Explorer take a memory dump from 64bit notepad.exe and save it as notepad64.dmp for example.
ShellcodeEmulator uses PyKD to parse and extract appropriate components from the process dump image. The extracted components include PEB and LDR structure and loaded DLLs. When shellcode calls some APIs from a DLL, the code from the extracted memory will be emulated. You can put code execution hook for potential APIs that the shellcode will run to observe and modify the behavior. If you don’t intercept any API calls, eventually the emulation will go and stop when it meets syscall instructions. Currently ShellcodeEmulator doesn’t provide emulation layer for syscall instructions yet.
ShellcodeEmulator
You need to have a git installation on the system with Python 3.x.
pip install git+https://github.com/ohjeongwook/ShellCodeEmulator
ShellCodeEmulator has a dependency on windbgtool and you can install using following command.
pip install git+https://github.com/ohjeongwook/windbgtool --upgrade
Usage
After installation, the you can provide ‘-d
> python -m shellcode_emulator.run

Usage: run.py [options] args

Options:
  -h, --help            show this help message and exit
  -b IMAGE_BASE, --image_base=IMAGE_BASE
                        Image base to load the shellcode inside process memory
  -d DUMP_FILENAME, --dump_filename=DUMP_FILENAME
                        A process dump file from normal Windows process
  -l LIST_FILENAME, --list_filename=LIST_FILENAME
                        A list filename generated by IDA (this can be used
                        instead of shellcode filename)
The following command shows how you can run 33312f916c5904670f6c3b624b43516e87ebb9e3.bin shellcode file using 64bit notepad process image.
python -m shellcode_emulator.run 33312f916c5904670f6c3b624b43516e87ebb9e3.bin -d notepad64.dmp
Start Of Emulation
When you emulate the shellcode, it will show that the shellcode executes “kernel32!WinExec” APIs.
* Setting up gs: 754d475000 (len=2000)
Writing shellcode to 7ff65b54ac50 (len=6a)
notepad!WinMainCRTStartup:	 7FF65B54AC50: 50 	push	rax
rax: 00000000 ebx: 00000000 ecx: 00000000 edx: 00000000
rsp: 754D87F000 rbp: 754D87F000 rsi: 00000000 rdi: 00000000
rip: 7FF65B54AC50
 fs: 00000070 gs: 0000007B cs: 0000008B  ds: 00000083  es: 00000000
notepad!WinMainCRTStartup+0x1:	+00000001: 51 	push	rcx
rax: 00000000 ebx: 00000000 ecx: 00000000 edx: 00000000
rsp: 754D87EFF8 rbp: 754D87F000 rsi: 00000000 rdi: 00000000
rip: 7FF65B54AC51
 fs: 00000070 gs: 0000007B cs: 0000008B  ds: 00000083  es: 00000000
kernel32!WinExec:	 7FFFA2D2F0E0: 48 8b c4 	mov	rax, rsp
kernel32!WinExec:	 7FFFA2D2F0E0: 48 8b c4 	mov	rax, rsp
kernel32!WinExec:	 7FFFA2D2F0E0: 48 8b c4 	mov	rax, rsp
kernel32!memset:	 7FFFA2CF2E67: ff 25 db 7c 05 00 	jmp	qword ptr [rip + 0x57cdb]
kernel32!memset:	 7FFFA2CF2E67: ff 25 db 7c 05 00 	jmp	qword ptr [rip + 0x57cdb]
kernel32!memset:	 7FFFA2CF2E67: ff 25 db 7c 05 00 	jmp	qword ptr [rip + 0x57cdb]
ntdll!memset:	 7FFFA2E65380: 48 8b c1 	mov	rax, rcx
ntdll!memset:	 7FFFA2E65380: 48 8b c1 	mov	rax, rcx
ntdll!memset:	 7FFFA2E65380: 48 8b c1 	mov	rax, rcx
KERNELBASE!CreateProcessA:	 7FFF9FA0C170: 4c 8b dc 	mov	r11, rsp
KERNELBASE!CreateProcessA:	 7FFF9FA0C170: 4c 8b dc 	mov	r11, rsp
KERNELBASE!CreateProcessA:	 7FFF9FA0C170: 4c 8b dc 	mov	r11, rsp
KERNELBASE!CreateProcessInternalA:	 7FFF9FA0C1F0: 4c 89 4c 24 20 	mov	qword ptr [rsp + 0x20], r9
KERNELBASE!CreateProcessInternalA:	 7FFF9FA0C1F0: 4c 89 4c 24 20 	mov	qword ptr [rsp + 0x20], r9
KERNELBASE!CreateProcessInternalA:	 7FFF9FA0C1F0: 4c 89 4c 24 20 	mov	qword ptr [rsp + 0x20], r9
Current implementation of ShellcodeEmulator focuses on very common APIs that are used for Windows shellcode, but it can be easily extended by modifying the code.
Conclusion
ShellcodeEmulator is a basic framework that can be easily extended to support many different kinds of shellcode emulation. Because it doesn’t rely on hardcoded PEB or mockup structure, you can easily setup different memory environment for different shellcode. Some shellcode might need a special environment and you can easily provide the environment by just providing approrpriate memory dumps matching the profile. The extensive API emulation is still in progress but as a research tool, it is readily usable and can be a good example of emulation and Unicorn framework can be applied real life defensive analysis work.