Intel PT (Processor Trace) is a technology that is part of the recent Intel CPUs. Intel Skylake and later CPU models comes with this feature. You can trace code execution at instruction level with triggering and filtering capabilities. With this article, we want to explore the practical application of this technology in exploit analysis.
Using Intel PT on Windows
For recording Intel PT records on Windows mainly three methods are available.
| Name | Description |
|---|---|
| WindowsIntelPT | Works for Windows 10 pre-RS6 |
| WinIPT | Windows 10 Post-RS6. Uses ipt.sys interface |
| Intel® Debug Extensions for WinDbg* for Intel® Processor Trace | Needs physical kernel debugging connection (ex. USB debugging) |
For analysis of the recorded packets, you can use libipt from Intel. Libipt is a standard library that can decode Intel PT packets. It provides basic tools like ptdump and ptxed.
Instruction Source
Intel PT only logs control flow changes. To decode Intel PT trace, we need image file where the instructions are executed. If we don’t have matching image for certain regions of the code execution, we might lose some execution information. This can happen with JIT code execution where there is no static image file available. Even shellcode can be challenging to trace because the shellcode instructions only live in the memory.
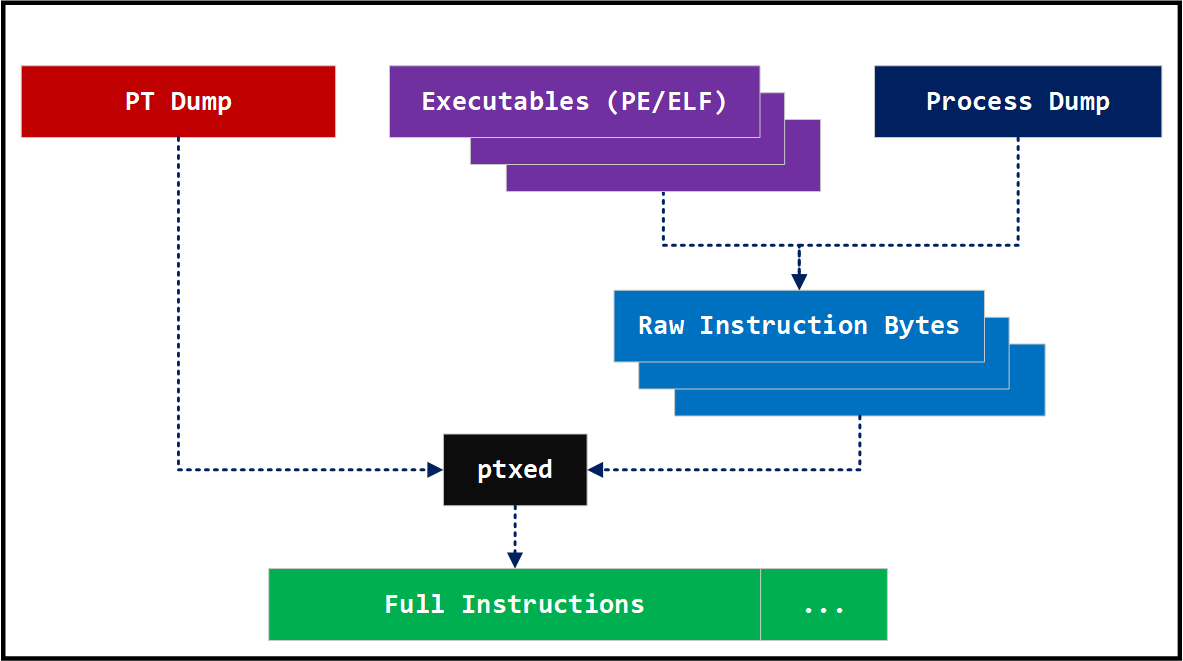
Because Intel PT doesn’t save instruction bytes or memory contents, you need to provide the instruction bytes for each IPs (Instruction Pointers). The following shows how the ptxed command works, for example.

Compressed Recording
One barrier in utilizing Intel PT in real world is the huge CPU time requirements to process Intel PT trace file. The trace file is compressed and it needs to be decompressed before used for any purposes. Libipt library can be used for decoding process but it is more of single threaded operation.
Methods
Similar to LBR, Intel PT works by recording branches. At runtime, when CPU encounters any branch instructions like “je”, “call”, “ret”, it will record the actions taken with the branch. With onditional jump instructions, it will record taken (T) or not taken (NT) using 1 bit. With indirect calls and jumps, it will record with target addresses. For unconditional branches like jumps or calls, it will not record the change because you can deduce the target jump address from the instructions. The IP (Instruction Pointer) to be recorded will be compared with last IP recording using one of the FUP, TIP, TIP.PGE or TIP.PGD packets. If upper parts of the address bytes overlap between them, those matching bytes will be suppressed in the current packet. Also, for the near return instructions, if the return target is the next instruction of the call instruction, it will not be recorded becaused it can be deduced from the control flow.
Packets
Descriptions on the packets used in IPT compression can be found from Intel® 64 and IA-32 Architectures Software Developer’s Manual.
There are many packets used to implement the recording mechanism. But, there are few important packet types that play main roles.
PSB (Packet Stream Boundary)
The PSB packet works as a synchronization point for a trace-packet decoding. It is the boundary in the trace log where the decompression process can be performed indepedently without any side effects. This offset is referred as “sync offset” in libipt library code because this is an offset in the trace file where you can safely start decoding the following packets.
TIP (Target IP)
TIP packets indicate the target IPs. This information can be used as the base point of instruction pointer.
TNT (Taken Not-Taken)
TNT packet is used to indicate whether conditional branch is taken or not. Any unconditional branch jumps will not be recorded because those flow control can be deduced from the process image.
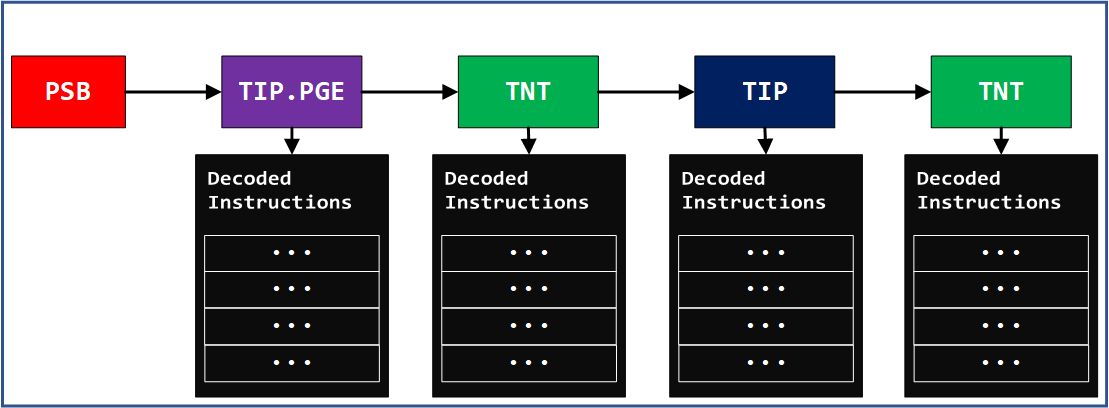
Overall, the decompressing process looks like following diagram. This is more of oversimplitifed view but it can show you how the decompresison works. The IntelPT log can be used to reconstruct full instruction executions and control flow changes with help from instruction bytes. Without instruction bytes, it only gives partial view of full instruction executions.

Example Trace Log
Here is a snippet of a IPT trace log, which is converted to text form using ptdump from libipt. It starts with PSB packet which indictates the position where you can safely decode following packets. There are some padding and timing related packets which can be ignored for now.
000000000000001c  psb
000000000000002c  pad
000000000000002d  pad
000000000000002e  pad
At offset 3db, there is a tip.pge packet. It means the instruction pointer is located at the location indicated by the packet which is 00007ffbb7d63470.
...
00000000000003db  tip.pge    3: 00007ffbb7d63470
00000000000003e2  pad
00000000000003e3  pad
From the process image, we can identify the address 00007ffbb7d63470 of tip.pge points to the following instructions.
seg000:00007FFBB7D63470                 mov     rcx, [rsp+20h]
seg000:00007FFBB7D63475                 mov     edx, [rsp+28h]
seg000:00007FFBB7D63479                 mov     r8d, [rsp+2Ch]
seg000:00007FFBB7D6347E                 mov     rax, gs:60h
seg000:00007FFBB7D63487                 mov     r9, [rax+58h]
seg000:00007FFBB7D6348B                 mov     rax, [r9+r8*8]
seg000:00007FFBB7D6348F                 call    sub_7FFBB7D63310
The tip packet indicates that the code started execution from address 00007ffbb7d63470 and continued execution until it encounteded call instruction at 00007FFBB7D6348F. Because the call is not indirect one, the call destination is pre-determined at compile time, so this tip.pge packet expands to the inside call instructions. The additional instructions from call target address 00007FFBB7D63310 will be decoded.
seg000:00007FFBB7D63310                 sub     rsp, 48h
seg000:00007FFBB7D63314                 mov     [rsp+48h+var_28], rcx
seg000:00007FFBB7D63319                 mov     [rsp+48h+var_20], rdx
seg000:00007FFBB7D6331E                 mov     [rsp+48h+var_18], r8
seg000:00007FFBB7D63323                 mov     [rsp+48h+var_10], r9
seg000:00007FFBB7D63328                 mov     rcx, rax
seg000:00007FFBB7D6332B                 mov     rax, cs:7FFBB7E381E0h
seg000:00007FFBB7D63332                 call    rax
At this point, there is a indirect call happens at address 00007FFBB7D63332. The next tip packet will give the necessary information where this call is jumping. The compression removes first 4bytes of address to save space. From the packet at 3ee, we can deduce that the call target is 00007ffbb7d4fb70.
...
00000000000003ee  tip        2: ????????b7d4fb70
00000000000003f3  pad
...
The decoding continues from 00007ffbb7d4fb70 until it encouters a conditional jump instruction at 00007FFBB7D4FB8C.
seg000:00007FFBB7D4FB70                 mov     rdx, cs:7FFBB7E38380h
seg000:00007FFBB7D4FB77                 mov     rax, rcx
seg000:00007FFBB7D4FB7A                 shr     rax, 9
seg000:00007FFBB7D4FB7E                 mov     rdx, [rdx+rax*8]
seg000:00007FFBB7D4FB82                 mov     rax, rcx
seg000:00007FFBB7D4FB85                 shr     rax, 3
seg000:00007FFBB7D4FB89                 test    cl, 0Fh
seg000:00007FFBB7D4FB8C                 jnz     short loc_7FFBB7D4FB95
seg000:00007FFBB7D4FB8E                 bt      rdx, rax
seg000:00007FFBB7D4FB92                 jnb     short loc_7FFBB7D4FBA0
seg000:00007FFBB7D4FB94                 retn
At this point, the tnt packet will give you information whether the conditional jump is taken or not taken. The following tnt.8 packet with 2 “..” means, it didn’t take two unconditional jumps.
00000000000003fe tnt.8 ..
Next, it will encounter ret instruction at 00007FFBB7D4FB94.
seg000:00007FFBB7D4FB94 retn
The return address can’t be reliably determined from the image itself even though it can calculate with some emulation. Basically, “ret” is an indirect jump, where it retrieves jump address from the current SP (stack pointer). The next tip packet will give you the address where this ret instruction is returning.
00000000000003ff tip 2: ????????b7d63334
The returned address disassembles like following and the code execution continues.
seg000:00007FFBB7D63334                 mov     rax, rcx
seg000:00007FFBB7D63337                 mov     rcx, [rsp+48h+var_28]
seg000:00007FFBB7D6333C                 mov     rdx, [rsp+48h+var_20]
seg000:00007FFBB7D63341                 mov     r8, [rsp+48h+var_18]
seg000:00007FFBB7D63346                 mov     r9, [rsp+48h+var_10]
seg000:00007FFBB7D6334B                 add     rsp, 48h
IPTAnalyzer
The IPT compression mechanism is very efficient and it needs help from disassembly engine to reconstruct full instructions. Even short amount of IPT trace recording can take a lot of CPU resources to decompress. One way, you can apply IP filterings to limit the output to minimize the amount of trace output. Sometimes huge trace log is inevitable for research purposes.
IPTAnalyzer is a tool to perform parallel processing of the IPT trace logs. The tool can process Intel PT trace using Python multiprocessing library and create a basic blocks cache file. This block information can be useful in overall analysis of the control flow changes. For example, if you want to collect instructions from specific image or address range, you can query this basic block cache file to find the locations that falls into the range before retrieving full instructions.
Case Study: CVE-2017-11882
CVE-2017-11882 is a vulnerability in Equation Editor in Microsoft Office. This can be a good exercise target to exercise how IPT can be used for exploit analysis. We will explain how you can use IPT and IPTAnalyzer to perform exploit analysis efficiently.
IPT Log Collection
You can use various approches to generate IPT trace logs. I used WinIPT to generate trace log.
We used malicious sample abbdd98106284eb83582fa08e3452cf43e22edde9e86ffb8e9386c8e97440624 to reproduce the exploit condition. Run ipttool.exe with process id and log file name. The process id 2736 is the vulnerable Equation Editor process. The trace output will be saved into EQNEDT32.pt file.
C:\Analysis\DebuggingPackage\TargetMachine\WinIPT>ipttool.exe --trace 2736 EQNEDT32.pt
/-----------------------------------------\
|=== Windows 10 RS5 1809 IPT Test Tool ===|
|===  Copyright (c) 2018 Alex Ionescu  ===|
|===    http://github.com/ionescu007   ===|
|===  http://www.windows-internals.com ===|
\-----------------------------------------/

[+] Found active trace with 1476395324 bytes so far
    [+] Trace contains 11 thread headers
        [+] Trace Entry 0 for TID 2520
               Trace Size: 134217728             [Ring Buffer Offset: 4715184]
              Timing Mode: MTC Packets          [MTC Frequency: 3, ClockTsc Ratio: 83]
        [+] Trace Entry 1 for TID 1CA8
               Trace Size: 134217728             [Ring Buffer Offset: 95936]
              Timing Mode: MTC Packets          [MTC Frequency: 3, ClockTsc Ratio: 83]
        [+] Trace Entry 2 for TID 8AC
               Trace Size: 134217728             [Ring Buffer Offset: 63152]
              Timing Mode: MTC Packets          [MTC Frequency: 3, ClockTsc Ratio: 83]
        [+] Trace Entry 3 for TID 1A88
               Trace Size: 134217728             [Ring Buffer Offset: 4560]
              Timing Mode: MTC Packets          [MTC Frequency: 3, ClockTsc Ratio: 83]
        [+] Trace Entry 4 for TID 1964
               Trace Size: 134217728             [Ring Buffer Offset: 45184]
              Timing Mode: MTC Packets          [MTC Frequency: 3, ClockTsc Ratio: 83]
        [+] Trace Entry 5 for TID 22D0
               Trace Size: 134217728             [Ring Buffer Offset: 6768]
              Timing Mode: MTC Packets          [MTC Frequency: 3, ClockTsc Ratio: 83]
        [+] Trace Entry 6 for TID 73C
               Trace Size: 134217728             [Ring Buffer Offset: 32480]
              Timing Mode: MTC Packets          [MTC Frequency: 3, ClockTsc Ratio: 83]
        [+] Trace Entry 7 for TID 1684
               Trace Size: 134217728             [Ring Buffer Offset: 285264]
              Timing Mode: MTC Packets          [MTC Frequency: 3, ClockTsc Ratio: 83]
        [+] Trace Entry 8 for TID 3C4
               Trace Size: 134217728             [Ring Buffer Offset: 99056]
              Timing Mode: MTC Packets          [MTC Frequency: 3, ClockTsc Ratio: 83]
        [+] Trace Entry 9 for TID 610
               Trace Size: 134217728             [Ring Buffer Offset: 4812464]
              Timing Mode: MTC Packets          [MTC Frequency: 3, ClockTsc Ratio: 83]
        [+] Trace Entry 10 for TID 1CD8
               Trace Size: 134217728             [Ring Buffer Offset: 7424]
              Timing Mode: MTC Packets          [MTC Frequency: 3, ClockTsc Ratio: 83]
[+] Trace for PID 2736 written to EQNEDT32.pt
Taking Process Memory Dump
You can use ProcDump or Process Explorer or even Windbg to take memory dump of the Equation Editor (EQNEDT32.exe). Instead of supplying individual image files to the libipt, IPTAnalyzer can use process memory dump to retrieve instruction bytes automatically.
Running iptanalyzer
For convenience, set %IPTANALYZERTOOL% as the root of the IPTAnalyzer folder in the following examples. By using decode_blocks.py, a block cache file can be generated. You need to provide -p option with IPT trace file name and -d option with process memory dump file.
python %IPTANALYZER%\pyipttool\decode_blocks.py -p PT\EQNEDT32.pt -d ProcessMemory\EQNEDT32.dmp -c block.cache
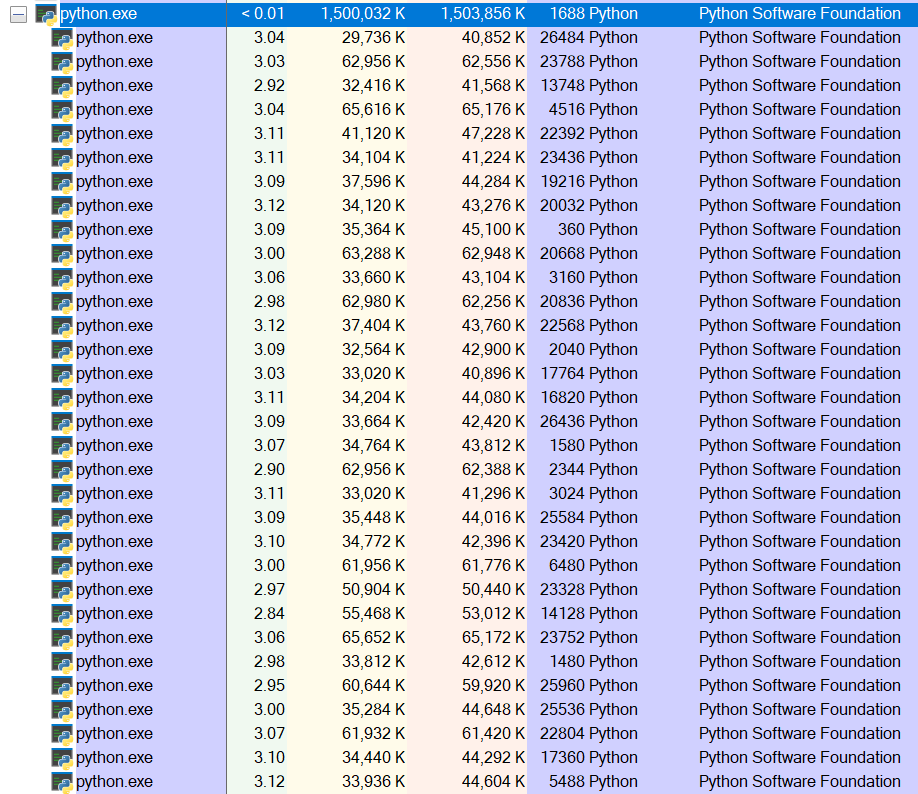
The following shows the parallel Python processes working to decode the trace file.

Dump EQNEDT32 Module Blocks
Because the EQNEDT32 main module has the vulnerability and an abnormal code execution pattern will happen inside or around the module address range, we want to enumerate blocks inside EQNEDT32 main module range, which is between 00400000 and 0048e000.
0:011> lmvm EQNEDT32
Browse full module list
start             end                 module name
00000000`00400000 00000000`0048e000   EQNEDT32   (deferred)
...
The dump_blocks.py tool can be used to enumerate any basic blocks inside specific address range.
python %IPTANALYZER%\pyipttool\dump_blocks.py -p PT\EQNEDT32.pt -d ProcessMemory\EQNEDT32.dmp -C 0 -c blocks.cache -s 0x00400000 -e 0x0048e000
The command will generate a full log of basic blocks matching the address range. Probably the transition into shellcode will happen at the end of the code execution from the vulnerable module, we focus on the basic block patterns at the end of the log. Notice the “sync_offset=2d236c” shows the location of PSB packet for these last basic block hits. This sync_offset value can be used to retrieve instructions around that point.
...
> 00000000004117d3 () (sync_offset=2d236c, offset=2d26f4)
	EQNEDT32!EqnFrameWinProc+0x2cf3:
00000000`004117d3 0fbf45c8        movsx   eax,word ptr [rbp-38h]

> 000000000041181e () (sync_offset=2d236c, offset=2d26f4)
	EQNEDT32!EqnFrameWinProc+0x2d3e:
00000000`0041181e 0fbf45fc        movsx   eax,word ptr [rbp-4]

> 0000000000411869 () (sync_offset=2d236c, offset=2d26f4)
	EQNEDT32!EqnFrameWinProc+0x2d89:
00000000`00411869 33c0            xor     eax,eax

> 000000000042fad6 () (sync_offset=2d236c, offset=2d26fc)
	EQNEDT32!MFEnumFunc+0x12d9:
00000000`0042fad6 c3              ret
Dump EQNEDT32 Module Instructions
Now, we know that the last basic blocks from EQNEDT32 module were executed inside “sync_offset=2d236c” PSB block. The dump_instructions.py script can be used to dump full instructions. Options like -S (start sync_offset) and -E (end sync_offset) can be used to specify sync_offset range.
python %IPTANALYZER%\pyipttool\dump_instructions.py -p ..\PT\EQNEDT32.pt -d ..\ProcessMemory\EQNEDT32.dmp -S 0x2d236c -E 0x2d307c
Locating the code transition
With the output from dump_instructions.py, you can easily identify where the code transition from EQNEDT32 to shellcode happens.
...
Instruction: EQNEDT32!EqnFrameWinProc+0x2d8b:
00000000`0041186b e900000000      jmp     EQNEDT32!EqnFrameWinProc+0x2d90 (00000000`00411870)

Instruction: EQNEDT32!EqnFrameWinProc+0x2d90:
00000000`00411870 5f              pop     rdi

Instruction: EQNEDT32!EqnFrameWinProc+0x2d91:
00000000`00411871 5e              pop     rsi

Instruction: EQNEDT32!EqnFrameWinProc+0x2d92:
00000000`00411872 5b              pop     rbx

Instruction: EQNEDT32!EqnFrameWinProc+0x2d93:
00000000`00411873 c9              leave

Instruction: EQNEDT32!EqnFrameWinProc+0x2d94:
00000000`00411874 c3              ret

Instruction: EQNEDT32!MFEnumFunc+0x12d9:
00000000`0042fad6 c3              ret

Instruction: 00000000`0019ee9c bac342baff      mov     edx,0FFBA42C3h

Instruction: 00000000`0019eea1 f7d2            not     edx

Instruction: 00000000`0019eea3 8b0a            mov     ecx,dword ptr [rdx]

Instruction: 00000000`0019eea5 8b29            mov     ebp,dword ptr [rcx]

Instruction: 00000000`0019eea7 bb3a7057f4      mov     ebx,0F457703Ah

Instruction: 00000000`0019eeac 81eb8a0811f4    sub     ebx,0F411088Ah

Instruction: 00000000`0019eeb2 8b1b            mov     ebx,dword ptr [rbx]

Instruction: 00000000`0019eeb4 55              push    rbp

Instruction: 00000000`0019eeb5 ffd3            call    rbx
...
From the above instruction listing, you can notice that there are two “ret” instructions at 00411874 and 0042fad6.
Instruction: EQNEDT32!EqnFrameWinProc+0x2d94:
00000000`00411874 c3              ret

Instruction: EQNEDT32!MFEnumFunc+0x12d9:
00000000`0042fad6 c3              ret
After these two “ret” instructions, the control transfers into a non-image address space.
Instruction: 00000000`0019ee9c bac342baff      mov     edx,0FFBA42C3h
Instruction: 00000000`0019eea1 f7d2            not     edx
Instruction: 00000000`0019eea3 8b0a            mov     ecx,dword ptr [rdx]
Instruction: 00000000`0019eea5 8b29            mov     ebp,dword ptr [rcx]
Notice that the instruction at 00000000`0019ee9c doesn’t have any matching module name retrieved which means, it has a high probability of being shellcode loaded inside dynamic memory.
Next Stage Shellcode
Following the shellcode, we can locate the position where next stage shellcode is executed at 0019eec1 with “jmp rax” instruction. Basically, we have full listing of shellcode execution in the Intel PT log.
Instruction: 00000000`0019eeb7 0567946d03      add     eax,36D9467h

Instruction: 00000000`0019eebc 2d7e936d03      sub     eax,36D937Eh

Instruction: 00000000`0019eec1 ffe0            jmp     rax
These are the next stage shellcode dumped by dump_instructions.py script.
Instruction: 00000000`00618111 9c              pushfq

Instruction: 00000000`00618112 56              push    rsi

Instruction: 00000000`00618113 57              push    rdi

Instruction: 00000000`00618114 eb07            jmp     00000000`0061811d

Instruction: 00000000`0061811d 9c              pushfq

Instruction: 00000000`0061811e 57              push    rdi

Instruction: 00000000`0061811f 57              push    rdi

Instruction: 00000000`00618120 81ef40460000    sub     edi,4640h

Instruction: 00000000`00618126 81ef574b0000    sub     edi,4B57h

Instruction: 00000000`0061812c 8dbfbc610000    lea     edi,[rdi+61BCh]

Instruction: 00000000`00618132 81c73b080000    add     edi,83Bh

Instruction: 00000000`00618138 5f              pop     rdi

Instruction: 00000000`00618139 5f              pop     rdi
Conclusions
Intel PT is a very useful technology that can be used for defensive and offensive security research. IPTAnalyzer is a tool that uses libipt library to speed up analysis using IPT trace logs. The exploit example here shows the benefits of using IPTAnalyzer tool to generate block cache file and use it for basic exploit investigation. Without help from Intel PT, this process can be tedious and might rely more on the instinct of the researchers. With Intel PT, there are potentials of automating this process and detecting malicious code activities automatically.
- DarunGrim is a threat knowledge and intelligence company. Please check out our security trainings (Korean Training). Please contact jeongoh@darungrim.com for inquiries.