On Windows platform, malware analysis has become more challenging. Living-off-the-land attacks are very common and there are many different and arbitrary techniques introduced to avoid easy detections and evade endpoint sensors. It is a challenge because one researcher needs to learn different skillsets. In many cases, the ultimate payload is PE file. But, analyzing the executables is the most difficult and time-consuming work. In most cases, analysts rely on sensor data or sandbox behavioral data. But you can lose a lot of contexts or hidden behaviors in that way. Through this series, we want to talk about advanced malware analysis techniques.
This article will talk about the basic steps of acquiring memory artifacts, which is very important because many malware use memory components like shellcode or reflectively loaded DLLs to perform its core operations. Those artifacts never touch file system and your sandbox might not have those artifacts in the system. For example, when you want to analyze those later, you might not have access to those components because it is already gone from the C&C server.
Case Study: Emotet
As an example, we used Emotet malware. Through this article, we want to discuss basic ways to extract memory artifacts for deep analysis.
Usual behavior
Emotet is one of the well analyzed malwares and the usual behavior looks like following.
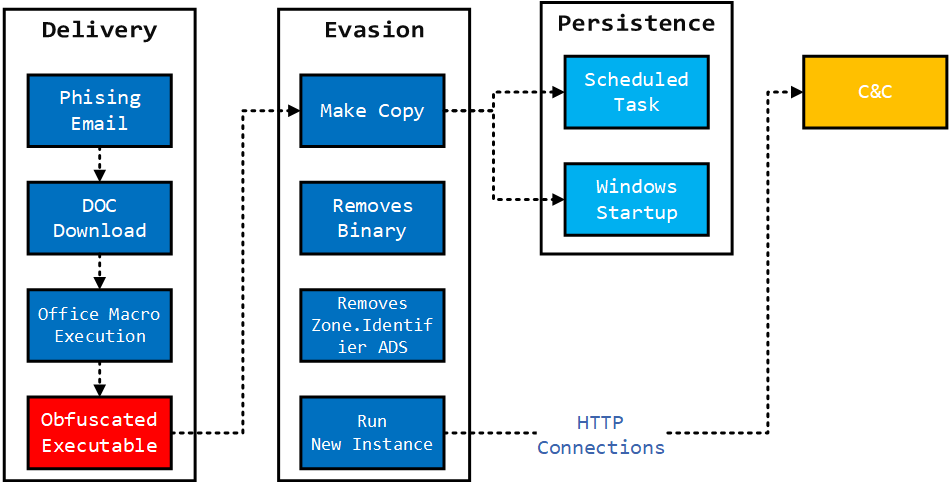
The sample we are using shows similar behavior. The delivery is done through phishing email’s link. When user clicks the link and opens the malicious Office file, it will run Office Macros. The Macro will lead to PowerShell or other Living-off-the-land methods which will run PE component eventually. To understand the ultimate behavior of Emotet, you need to analyze the behavior the PE payload
Sample
The following sample was used for the example analysis.
SHA256: 4d0539b3f9eb7d08f259aee1935e7bd75644579c659ac1be2f103988f763d4a8
The sample can be acquired from bazaar.abuse.ch. The sandbox data for this sample is available from capesandbox.
Tools
The following tools are used for the analysis of this malware.
- Process Dumping Tool
- Debugger: The debugger should be able to load process dump image file
- Virtual Machines (One of Theses)
- VMWare
- Hyper-V
- VirtualBox
- Disassemblers
- IDA
- Ghidra
PE File
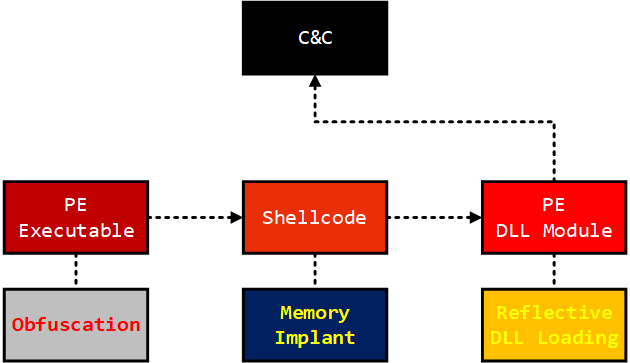
The following diagram explains how the Emotet PE file loads additional components like shellcode and reflectively load DLL. After the first stage is de-obfuscated, it will load a small shellcode to run PE file on the memory. It will perform C&C communication.
Forensic Approach - acquiring artifacts
We want to use forensic analysis of the process image to acquire these components. Usually it is more convenient and time-result efficient than debugging through the process. It just needs a process image dump when the malware finishes its first stage behavior. Simply, you can use Process Explorer or procdump tool.
-
In virtual machine, place the malware and run the sample.
-
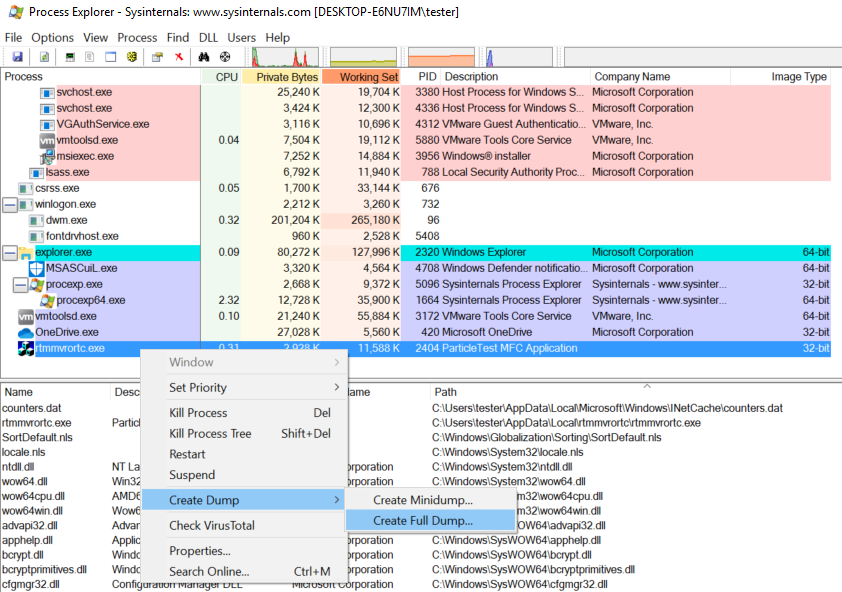
The following shows how you can dump target process image (rtmmvrotc.exe) using Process Explorer.
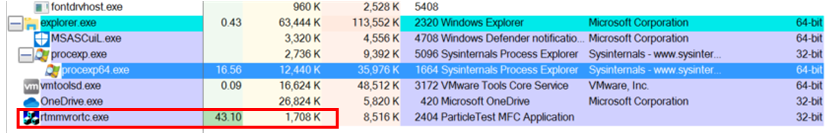
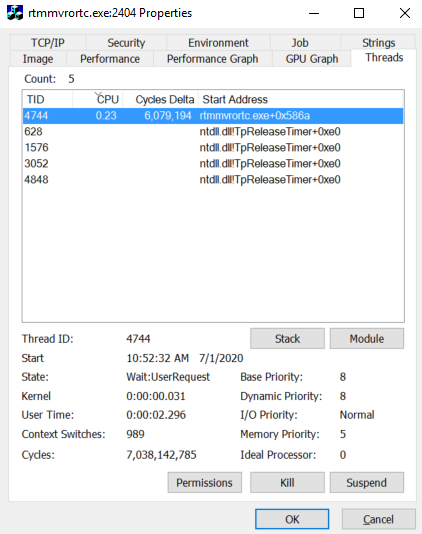
- You can check out the properties of the process.
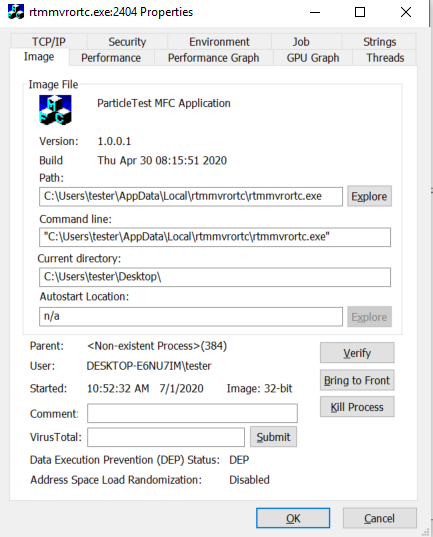
This malware disguise itself as an MFC application. Also, it copied itself to other location after removing original file.
- The following shows the multiple threads running inside the process. But, you need a debugger to get better view of the threads.
Memory Dump Analysis
Using memory dumps has some benefits over using live debugging. You can leave the artifacts and can combine with static analysis. If you track a malware family, you can use these artifacts later to compare form factor changes in their shellcode and PE files.
- Using process explorer, you can choose Create Dump -> Create Full Dump action after right click.
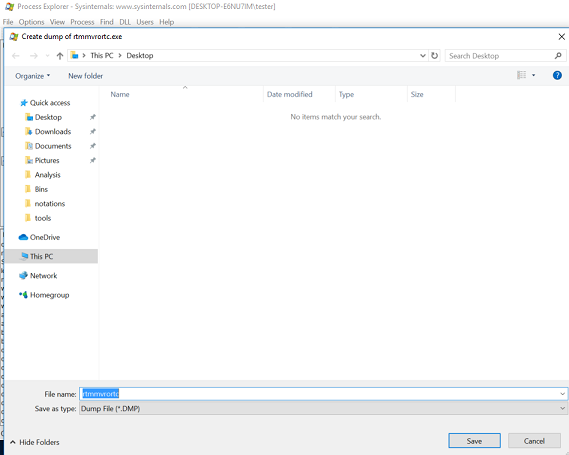
- Choose filename for output.
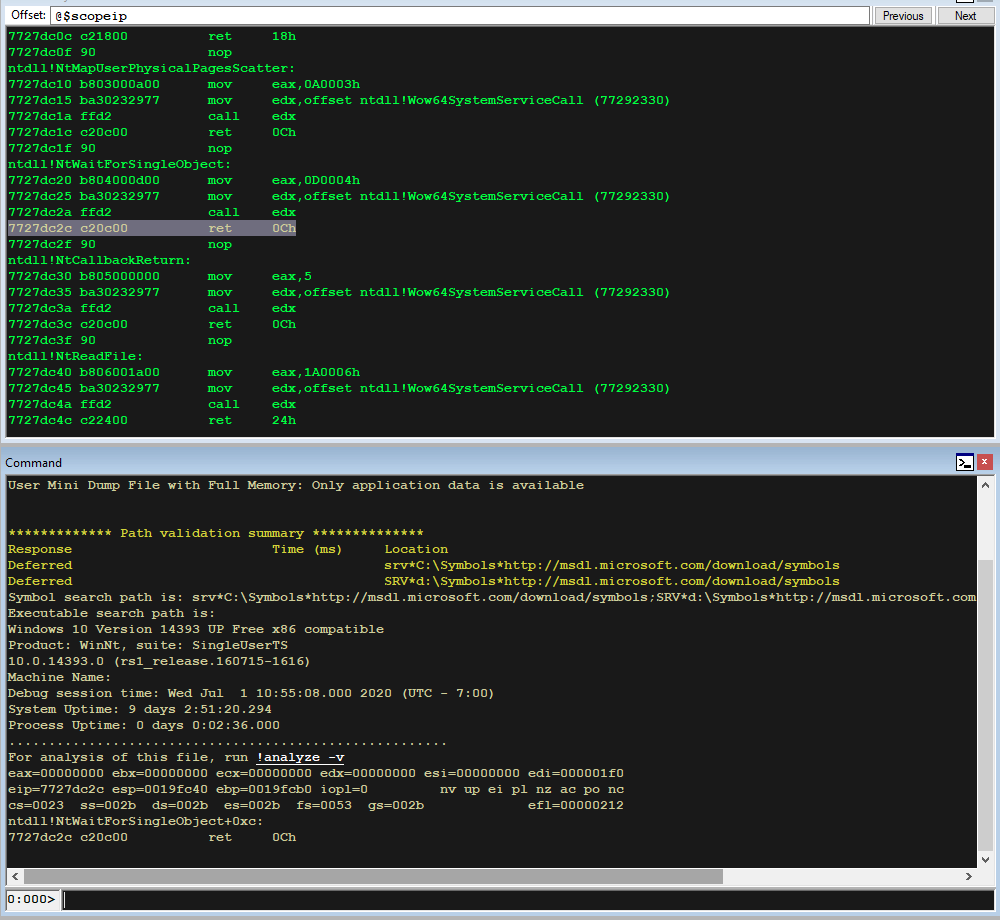
- You can copy out the dump file to analysis machine. You can use WinDbg to load the dump file using File -> Open Crash Dump action or drag-and-drop.
Symbol
You can use following command to load Microsoft’s symbols to use advanced features of WinDbg.
0:000> .sympath srv*https://msdl.microsoft.com/download/symbols
Symbol search path is: srv*https://msdl.microsoft.com/download/symbols
Expanded Symbol search path is: srv*https://msdl.microsoft.com/download/symbols

************* Path validation summary **************
Response                         Time (ms)     Location
Deferred                                       srv*https://msdl.microsoft.com/download/symbols
You can reload symbols using .reload command.
0:000> .reload
.......................................................
Thread
Using “~*kp” command you can list threads with callstack frames in the process.
- ~: thread command
- *: run following commands for every thread
- kp: list callstack frames
0:000> ~*kp

.  0  Id: 964.1288 Suspend: 0 Teb: 00318000 Unfrozen
 # ChildEBP RetAddr
00 0019fc3c 75bfac89 ntdll!NtWaitForSingleObject+0xc
01 0019fcb0 75bfabe2 KERNELBASE!WaitForSingleObjectEx+0x99
02 0019fcc4 00538800 KERNELBASE!WaitForSingleObject+0x12
WARNING: Frame IP not in any known module. Following frames may be wrong.
03 0019fd88 005351f5 0x538800
04 0019fd8c 005203da 0x5351f5
05 0019fdf4 00520029 0x5203da
06 0019fe0c 00402a2d 0x520029
07 0019fe40 00402ad4 rtmmvrortc+0x2a2d
08 00000000 00000000 rtmmvrortc+0x2ad4

   1  Id: 964.274 Suspend: 0 Teb: 0031e000 Unfrozen
 # ChildEBP RetAddr
00 0264fdd8 772462c1 ntdll!NtWaitForWorkViaWorkerFactory+0xc
01 0264ff80 76df62c4 ntdll!TppWorkerThread+0x2a1
02 0264ff94 77270609 kernel32!BaseThreadInitThunk+0x24
03 0264ffdc 772705d4 ntdll!__RtlUserThreadStart+0x2f
04 0264ffec 00000000 ntdll!_RtlUserThreadStart+0x1b

   2  Id: 964.628 Suspend: 0 Teb: 00321000 Unfrozen
 # ChildEBP RetAddr
00 0274fc74 75c02afa ntdll!NtDelayExecution+0xc
01 0274fcdc 75c02a5f KERNELBASE!SleepEx+0x8a
02 0274fcec 71e9d56c KERNELBASE!Sleep+0xf
03 0274fd0c 71e9d8da winhttp!SafeTerminateDll+0xac
04 0274fd50 77236375 winhttp!FailFastThreadpoolWaitCallback<&SafeTerminateDll>+0x2a
05 0274fdbc 772362ba ntdll!TppExecuteWaitCallback+0x7a
06 0274fddc 7724653a ntdll!TppWaitCompletion+0x8a
07 0274ff80 76df62c4 ntdll!TppWorkerThread+0x51a
08 0274ff94 77270609 kernel32!BaseThreadInitThunk+0x24
09 0274ffdc 772705d4 ntdll!__RtlUserThreadStart+0x2f
0a 0274ffec 00000000 ntdll!_RtlUserThreadStart+0x1b

   3  Id: 964.bec Suspend: 0 Teb: 00324000 Unfrozen
 # ChildEBP RetAddr
00 0284fdd8 772462c1 ntdll!NtWaitForWorkViaWorkerFactory+0xc
01 0284ff80 76df62c4 ntdll!TppWorkerThread+0x2a1
02 0284ff94 77270609 kernel32!BaseThreadInitThunk+0x24
03 0284ffdc 772705d4 ntdll!__RtlUserThreadStart+0x2f
04 0284ffec 00000000 ntdll!_RtlUserThreadStart+0x1b

   4  Id: 964.12f0 Suspend: 0 Teb: 00327000 Unfrozen
 # ChildEBP RetAddr
00 0294fdd8 772462c1 ntdll!NtWaitForWorkViaWorkerFactory+0xc
01 0294ff80 76df62c4 ntdll!TppWorkerThread+0x2a1
02 0294ff94 77270609 kernel32!BaseThreadInitThunk+0x24
03 0294ffdc 772705d4 ntdll!__RtlUserThreadStart+0x2f
04 0294ffec 00000000 ntdll!_RtlUserThreadStart+0x1b
- The first thread 0 looks suspicious with no-module call stack frames. Those call stack frames show the instruction addresses that don’t belong to any loaded modules. This is a good signal in finding loaded shellcode or reflectively loaded PE components.
.  0  Id: 964.1288 Suspend: 0 Teb: 00318000 Unfrozen
 # ChildEBP RetAddr
00 0019fc3c 75bfac89 ntdll!NtWaitForSingleObject+0xc
01 0019fcb0 75bfabe2 KERNELBASE!WaitForSingleObjectEx+0x99
02 0019fcc4 00538800 KERNELBASE!WaitForSingleObject+0x12
WARNING: Frame IP not in any known module. Following frames may be wrong.
03 0019fd88 005351f5 0x538800 <--- no module associated
04 0019fd8c 005203da 0x5351f5 <--- no module associated
05 0019fdf4 00520029 0x5203da <--- no module associated
06 0019fe0c 00402a2d 0x520029 <--- no module associated
07 0019fe40 00402ad4 rtmmvrortc+0x2a2d
08 00000000 00000000 rtmmvrortc+0x2ad4
The call stack frame from 03 to 06’s RetAddr doesn’t have any modules. This can happen with JIT (Just-In-Time) code on the heap, too.
The frame 03 can be investigated by analyzing the return address 0x538800 using !address command.
0:000> !address 00538800


Mapping file section regions...
Mapping module regions...
Mapping PEB regions...
Mapping TEB and stack regions...
Mapping heap regions...
Mapping page heap regions...
Mapping other regions...
Mapping stack trace database regions...
Mapping activation context regions...

Usage:                  <unknown>
Base Address:           00531000
End Address:            0053a000
Region Size:            00009000 (  36.000 kB)
State:                  00001000          MEM_COMMIT
Protect:                00000020          PAGE_EXECUTE_READ
Type:                   00020000          MEM_PRIVATE
Allocation Base:        00530000
Allocation Protect:     00000004          PAGE_READWRITE


Content source: 1 (target), length: 1800
The memory region that contains 0x00538800 starts from 0x00531000 with 0x9000 bytes. This memory area has PAGE_EXECUTE_READ protection. This memory area is executable with MEM_PRIVATE type.
MEMORY_BASIC_INFORMATION structure documents the following memory types.
| Type | Definition | Meaning |
|---|---|---|
| MEM_IMAGE | 0x1000000 | Indicates that the memory pages within the region are mapped into the view of an image section. |
| MEM_MAPPED | 0x40000 | Indicates that the memory pages within the region are mapped into the view of a section. |
| MEM_PRIVATE | 0x20000 | Indicates that the memory pages within the region are private (that is, not shared by other processes). |
MEM_PRIVATE is the memory space that is private to the process. On Windows platform, DLL files are loaded as MEM_IMAGE that can be shared between difference processes to save memory space.
Artifacts Extraction
We can use !address to list any suspicious memory regions in the process.
- You can use -f option to filter in executable regions.
0:000> !address -f:PAGE_EXECUTE

  BaseAddr EndAddr+1 RgnSize     Type       State                 Protect             Usage
-----------------------------------------------------------------------------------------------
  401000   406000     5000 MEM_IMAGE   MEM_COMMIT  PAGE_EXECUTE_READ                  Image      [rtmmvrortc; "C:\Users\tester\AppData\Local\rtmmvrortc\rtmmvrortc.exe"]
  511000   513000     2000 MEM_IMAGE   MEM_COMMIT  PAGE_EXECUTE_READ                  Image      [mshta; "C:\Windows\System32\mshta.exe"]
  520000   52a000     a000 MEM_PRIVATE MEM_COMMIT  PAGE_EXECUTE_READWRITE             <unknown>  [.....X..........]
  531000   53a000     9000 MEM_PRIVATE MEM_COMMIT  PAGE_EXECUTE_READ                  <unknown>  [....S..A...A..8.]
 2180000  21c1000    41000 MEM_PRIVATE MEM_COMMIT  PAGE_EXECUTE_READWRITE             <unknown>  [MZ..............]
53a21000 53a54000    33000 MEM_IMAGE   MEM_COMMIT  PAGE_EXECUTE_READ                  <unknown>  [................]
53a81000 53abf000    3e000 MEM_IMAGE   MEM_COMMIT  PAGE_EXECUTE_READ                  <unknown>  [................]
53b01000 53b04000     3000 MEM_IMAGE   MEM_COMMIT  PAGE_EXECUTE_READ                  <unknown>  [................]
53b07000 53b08000     1000 MEM_IMAGE   MEM_COMMIT  PAGE_EXECUTE_READ                  <unknown>  [..p.S3...A......]
6c921000 6c990000    6f000 MEM_IMAGE   MEM_COMMIT  PAGE_EXECUTE_READ                  Image      [apphelp; "C:\Windows\System32\apphelp.dll"]
6f5a1000 6f5a3000     2000 MEM_IMAGE   MEM_COMMIT  PAGE_EXECUTE_READ                  Image      [dpapi; "C:\Windows\System32\dpapi.dll"]
6f6a1000 6f6a4000     3000 MEM_IMAGE   MEM_COMMIT  PAGE_EXECUTE_READ                  Image      [winnsi; "C:\Windows\System32\winnsi.dll"]
6f6b1000 6f6bb000     a000 MEM_IMAGE   MEM_COMMIT  PAGE_EXECUTE_READ                  Image      [ondemandconnroutehelper; "C:\Windows\System32\ondemandconnroutehelper.dll"]
6fea1000 6ff08000    67000 MEM_IMAGE   MEM_COMMIT  PAGE_EXECUTE_READ                  Image      [dnsapi; "C:\Windows\System32\dnsapi.dll"]

...

76df0000 76e54000    64000 MEM_IMAGE   MEM_COMMIT  PAGE_EXECUTE_READ                  Image      [kernel32; "C:\Windows\System32\kernel32.dll"]
76ec1000 76fa8000    e7000 MEM_IMAGE   MEM_COMMIT  PAGE_EXECUTE_READ                  Image      [crypt32; "C:\Windows\System32\crypt32.dll"]
77041000 77051000    10000 MEM_IMAGE   MEM_COMMIT  PAGE_EXECUTE_READ                  Image      [win32u; "C:\Windows\System32\win32u.dll"]
77061000 7709c000    3b000 MEM_IMAGE   MEM_COMMIT  PAGE_EXECUTE_READ                  Image      [shlwapi; "C:\Windows\System32\shlwapi.dll"]
770b1000 771e6000   135000 MEM_IMAGE   MEM_COMMIT  PAGE_EXECUTE_READ                  Image      [gdi32full; "C:\Windows\System32\gdi32full.dll"]
77211000 7731c000   10b000 MEM_IMAGE   MEM_COMMIT  PAGE_EXECUTE_READ                  Image      [ntdll; "C:\Windows\System32\ntdll.dll"]
Most of the regions has MEM_IMAGE type and you can safely exclude them from analysis for now. There are three memory regions with MEM_PRIVATE type.
  BaseAddr EndAddr+1 RgnSize     Type       State                 Protect             Usage
-----------------------------------------------------------------------------------------------

...

  520000   52a000     a000 MEM_PRIVATE MEM_COMMIT  PAGE_EXECUTE_READWRITE             <unknown>  [.....X..........]
  531000   53a000     9000 MEM_PRIVATE MEM_COMMIT  PAGE_EXECUTE_READ                  <unknown>  [....S..A...A..8.]
 2180000  21c1000    41000 MEM_PRIVATE MEM_COMMIT  PAGE_EXECUTE_READWRITE             <unknown>  [MZ..............]

...
Interestingly, all these areas have unknown usage value. Two areas have PAGE_EXECUTE_READWRITE, which means the areas are writable. In many cases having a writable executable memory area is not a usual behavior these days because it is a security risk itself. Also, memory area starts from 2180000 starts with “MZ” string which indicates that it might be a PE image.
- For further investigation, first we want to start investigating memory region 00531000 by extracting it from the image as a separate file using .writemem command.
0:000> .writemem d:\00531000.dmp 00531000 L00009000
Writing 9000 bytes..................
Shellcode Analysis
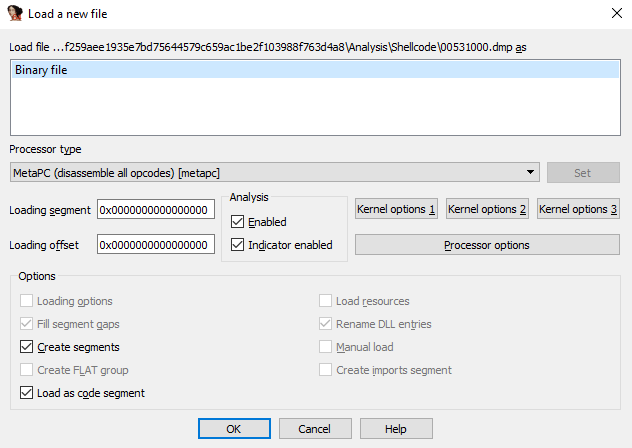
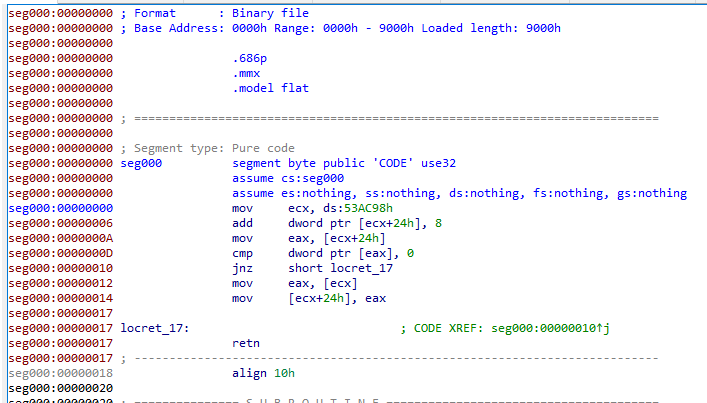
Our assumption is that the memory area has a shellcode. Using IDA or any disassemblers, load the file. The file doesn’t have any meta data, but more raw memory bytes, so choose bitness (32 bit) and architecture (MetaPC) manually.
- You can force to make regions interpreted as code using “c” command.
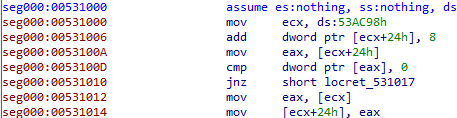
Rebase
Shellcode doesn’t have meta data, the base will be set to 0. We extracted the memory region from 0x00531000, so rebasing will make further analysis more convenient.
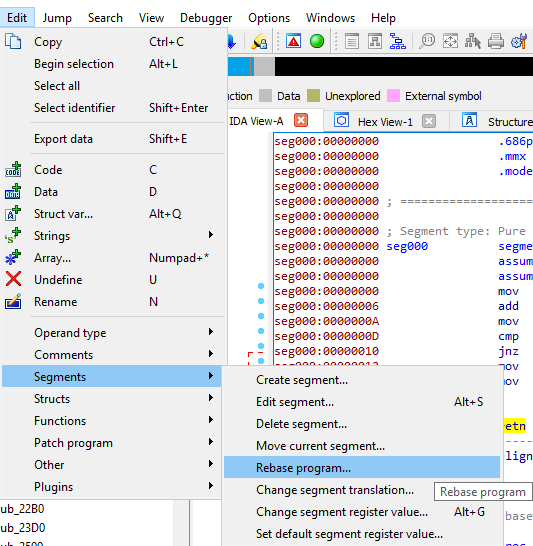
- Choose Edit -> Segments -> Rebase program command to rebase the binary.
- Set 0x00531000 as the rebase value.
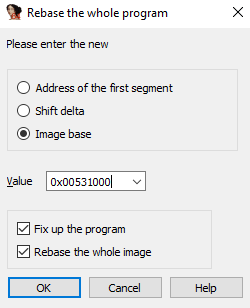
- After rebase, you will have same memory view between WinDbg session and IDA session.
This is the basic approach in extracting shellcode and preparing for further analysis.
Conclusion
This is the first step in applying forensic analysis approach to the Windows malware analysis. With next article, we will discuss how to get behavioral data from the extracted shellcode or reflectively loaded DLLs quickly. Sandbox can give you macro-level behavioral data, but deep analysis for each component always give you more insights and data for the actors. This can help in establishing short-term and long-term malware defense strategy on your organization.